Each month, the CleanData team will publish an update to the Electricity Price Hub (EPH), our partnership with Heatmap News and MIT. The platform tracks monthly residential electricity rates and bills at the utility level across the country. These updates share what the data shows: where prices are moving, which utilities are driving changes, and what is behind the numbers. This is our July 2026 update.
—–
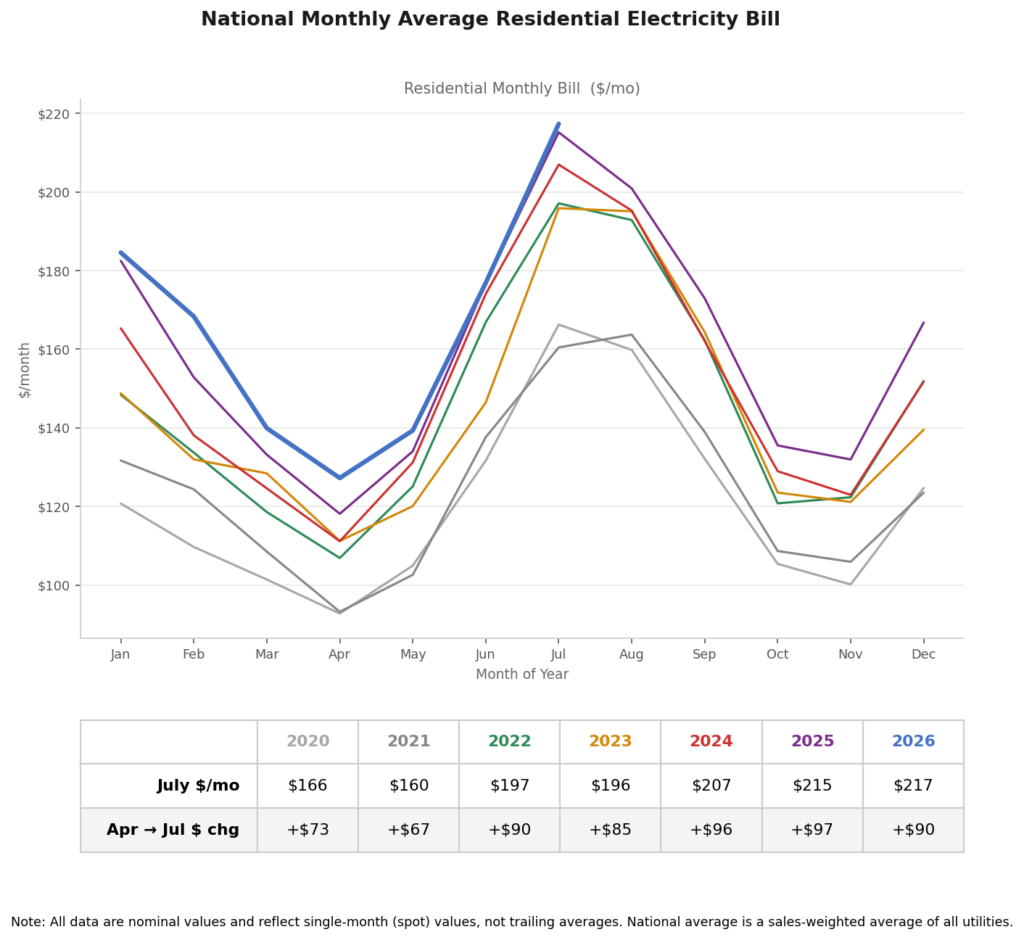
In July 2026, the national average household electricity bill reached a record high of $217/month. That represents a $90/month or 70% swing from than the lowest bill of the year so far.
State and utility level trends
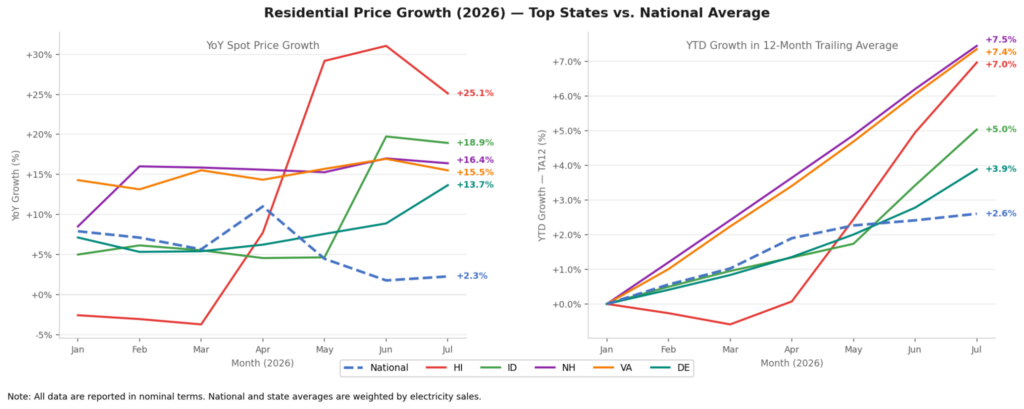
Elevated fuel and purchased power costs continue to drive high rates across Hawaii’s major utilities. Hawaii Electric Light Co’s energy cost recovery charge hit a new high in July. Hawaii Electric Co’s ECR has come down slightly from May 2026 levels but remains 56% higher than in July 2025.
Fuel costs are also contributing to the steep rise in Dominion Energy rates in Virginia, which are up 19 percent year over year. One important factor in that increase was an increase in Dominion’s fuel charge rider, which increased by 27 percent in July, reaching its highest level since January 2020. The new fuel charge contributed around $53 to the average July 2026 bill, a $12 increase over July 2025.
Increases in utility default supply service charges are driving rates higher in New Hampshire and Delaware. Residential rates are up across all four of New Hampshire’s largest utilities. Liberty Utilities has seen the biggest jump in rates (+29% YoY), attributable to an increase in its default energy service charge, which is set to increase again next month for the state’s three IOUs. In Delaware, a 19% increase in Delmarva Power’s Standard Offer Service supply charge contributed to a 21% increase in overall rates year over year. Additionally, the Delaware Public Service Commission approved interim rates in Delmarva Power’s pending rate case, increasing Delmarva Power’s customer and distribution charges by around 9 percent each this month.
Seasonal rate adjustments are showing up in Idaho rate trends, where Idaho Power’s average residential rate is 24% higher than it was one year ago. New rates approved in Idaho Power’s most recent rate case took effect at the beginning of the year, but the approved rates included a sharper increase in the summer energy charge than in the winter energy charge, contributing to a large year-over-year increase in July.
Other developments in July
Perhaps anticipating sharp summer bill increases, policymakers in several states adopted new measures targeting electricity affordability and accountability.
- In New Jersey, Governor Sherrill signed a set of laws aimed at limiting utility return on equity and increasing oversight of utility transmission spending, among other things, and the New Jersey Board of Public Utilities (BPU) approved plans for New Jersey households to receive a $25 bill credit in August. The New Jersey bill credits follow from Governor Sherrill’s day-one executive order, which called for credits to offset increases in the cost of electricity supply that took effect in June. As previously outlined, the supply charges that ultimately took effect last month varied across the four utilities, but customers will receive the bill relief regardless. Governor Sherrill’s first executive order also called on BPU to consider pausing any increases in utility delivery charges. However, on June 30, 2026, BPU approved a rate hike for Rockland Electric that added around $27 to its July average bill compared to the July 2025 average.
- Illinois Governor Pritzker signed legislation expanding low-income discounts and mandating increased transparency into utility fees and surcharges.
- The Indiana Utility Regulatory Commission launched two formal investigations, one into authorized return on equity set by the Commission for the state’s investor-owned utilities and a second on the use of “trackers” or rate adjustment mechanisms used by utilities to recover costs outside of base rates. In July 2026, average residential bills from Indiana’s five IOUs included from 7 to 11 different tracker charges contributing anywhere from 1.5% to 18% of the total bill.
Contact
For more information, feedback, or questions, please contact Lauren@cleanecon.org and Steven@cleanecon.org.