Each month, the CleanData team will publish an update to the Electricity Price Hub (EPH), our partnership with Heatmap News and MIT. The platform tracks monthly residential electricity rates and bills at the utility level across all 50 states. These updates share what the data shows: where prices are moving, which utilities are driving changes, and what is behind the numbers. This is our May 2026 update.
—–
Household electricity bills continue to rise across the country. In May 2026, the national average bill, adjusted for seasonal variation in electricity usage by taking a 12-month trailing average, was $39/month more than it was five years ago and $8/month more than it was last year.
| May 2026 | Change from May 2025 | Change from May 2021 | |
| National Average Price (12-mo trailing ave) | 17.4 cents/kWh | +1.0 cents/kWh (+6.4%) | +4.6 cents/kWh (+35.6%) |
| National Average Price | 17.5 cents/kWh | +0.6 cents/kWh (+3.6%) | +4.2 cents/kWh (+31.4%) |
| National Average Bill (12-mo trailing ave) | $160/mo | +$8/mo (+5.4%) | +$39/mo (+31.9%) |
| National Average Bill | $140/mo | +$6/mo (+4.6%) | +$39/mo (+38.1%) |
| National Average Usage | 754 kWh | +11 kWh (+1.4%) | +23 kWh (+3.1%) |
Bill and price data is nominal and national averages are weighted by electricity sales
Nationwide, growth in rates and bills in 2026 to date tracks closely with previous years. However, in several states, rates are rising faster than the national average.

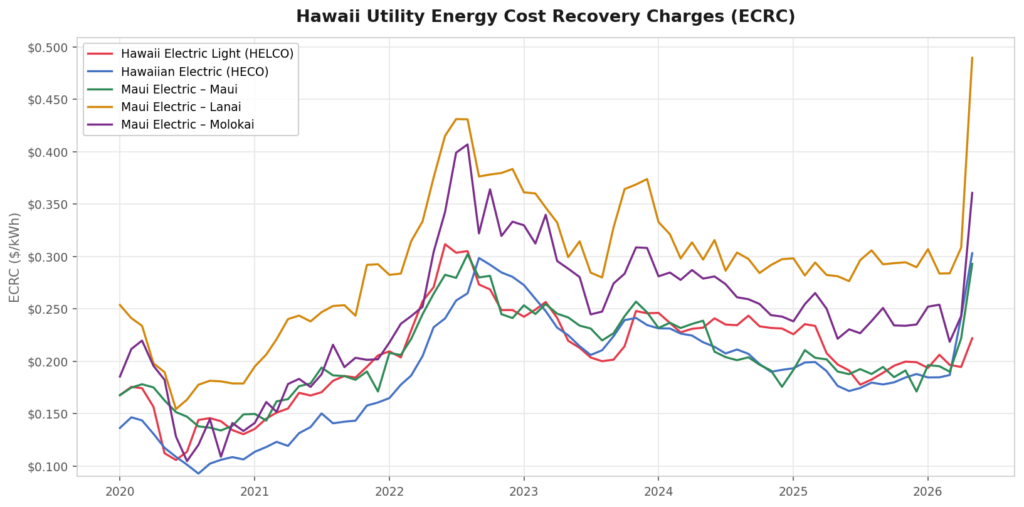
The most noteworthy state-level shift is in Hawaii, where energy cost recovery factors, the charge utilities use to recover purchased power and fuel costs, have spiked due to the rise in global oil prices. As a result, of the 10 utilities with fastest year-over-year growth in rates, six are Hawaii utilities. From January through May 2026, Maui Electric’s Lanai Division energy cost recovery factor increased by a remarkable 18 cents/kWh, a nearly 60% increase. This alone added $76 to average bills in May compared to January of this year, despite average residential usage being lower in May.
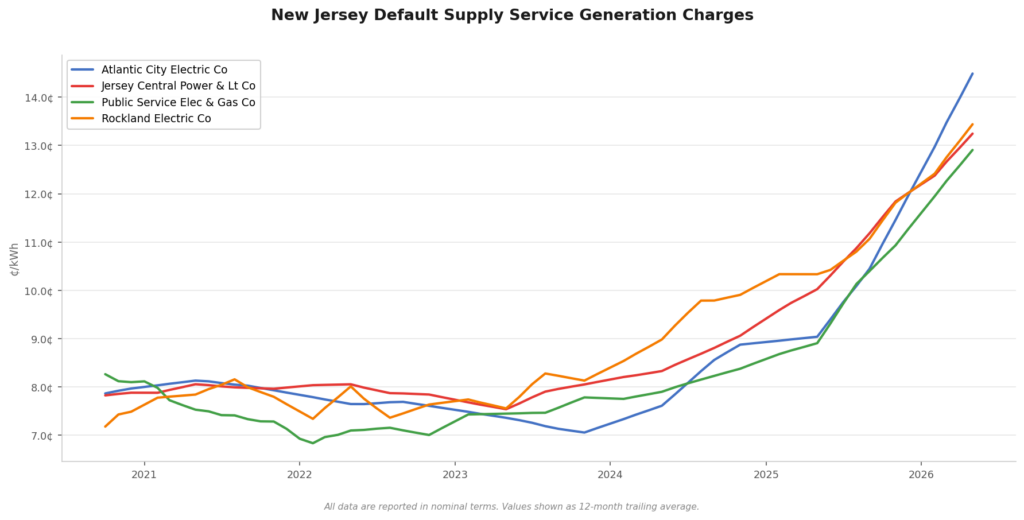
Rates in Washington DC are up nearly 22% year over year, with 85% of that increase linked to rising generation rates. This is part of an ongoing trend attributable to regional dynamics that have put upward pressure on wholesale energy and capacity prices. New Jersey rates have also continued to rise for similar reasons. For example, Atlantic City Electric’s Generation Service charges were 68% higher in May 2026 than in May 2025, adding $47/month on average to household bills.
South Dakota is also among the states experiencing above average growth in rates in 2026 so far. However, that increase is largely attributable to an interim rate increase implemented by the state’s largest utility in January 2026 that will soon be partially reversed. Xcel Energy implemented interim rates for South Dakota customers on January 1, 2026 as part of an ongoing general rate case. That case concluded at the beginning of May, and the rates that were ultimately approved are substantially lower than the implemented interim rates. As a result, lower-than-anticipated rates will go into effect in July, and customers will receive a refund with interest for the difference between the interim and ultimately-approved rates on their August and September bills.
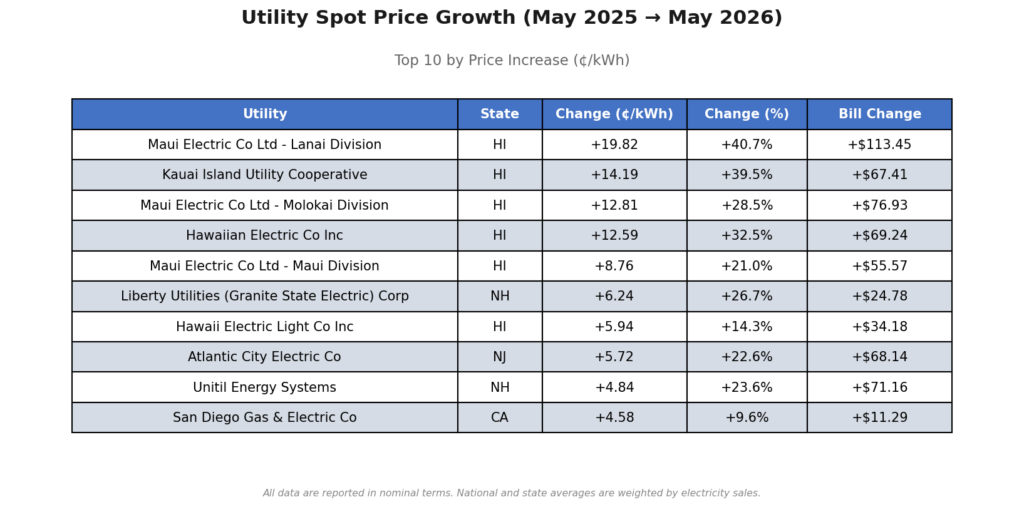
Two of the 10 utilities with fastest year-over-year growth in rates are in New Hampshire. Liberty Utilities, which serves around 6% of residential customers in the state, saw a 27% increase in rates from May 2025 to May 2026, with 85% of the change attributable to an increase in its energy service charge, which recovers the cost of the commodity it delivers to households. Similarly, Unitil, which serves around 10% of New Hampshire customers experienced a 45% increase in its energy service charge. In both cases, these supply charges have trended up since mid-2025, after falling from peak levels in 2022 and 2023.
Contact
For more information, feedback, or questions, please contact Lauren@cleanecon.org and Steven@cleanecon.org.